Which Games Are Actually Profitable to Stream in 2026? Saturation Ratios and Revenue Breakdown
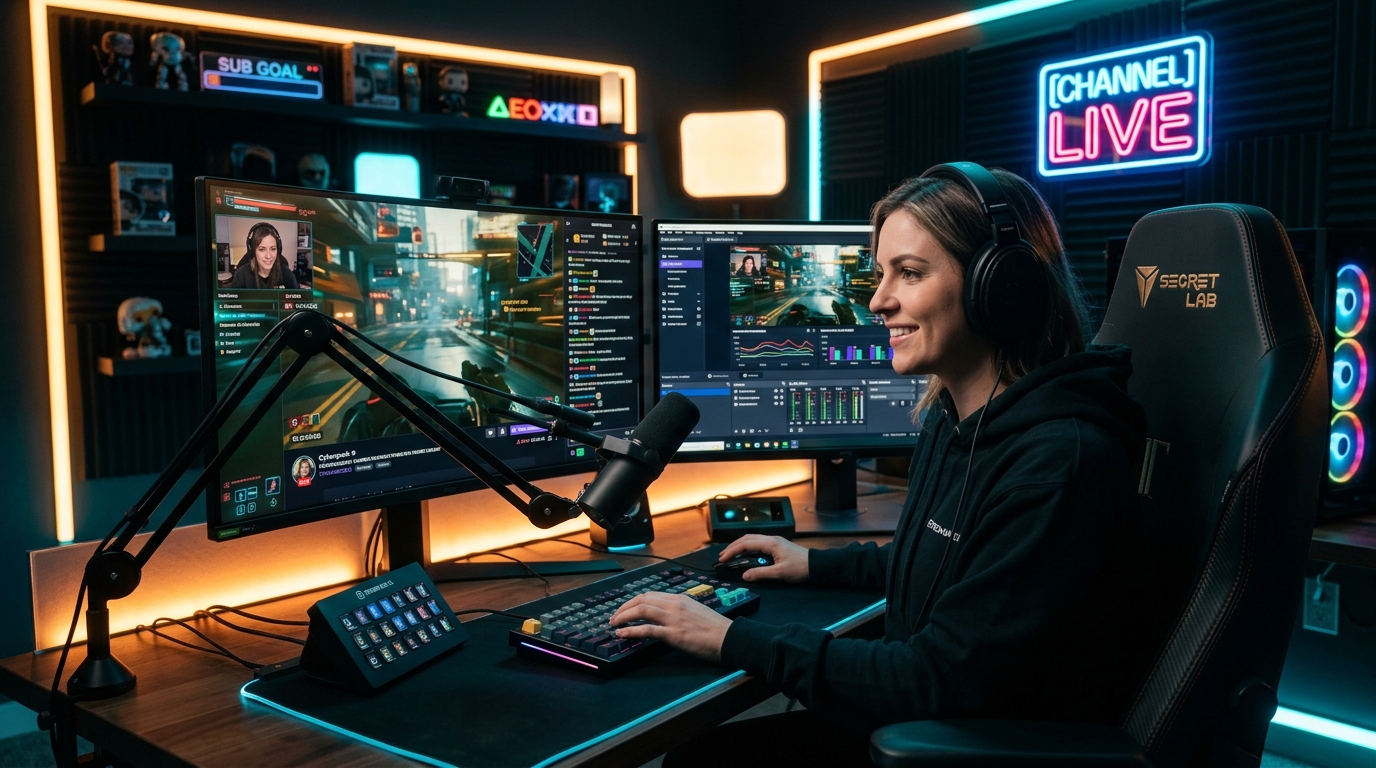
Every rookie content creator makes the exact same strategic mistake: download OBS, go live on Warzone, Fortnite, or League of Legends, and wonder why they are stuck at two viewers after 300 hours on air. In 2026, streaming profitability across Twitch, Kick, and YouTube Gaming is not a matter of luck: it is a mathematical equation governed by the Category Saturation Ratio (CSR), audience demographics, and each platform's revenue-sharing model.
1. Statistical Saturation Analysis: The Viewer-to-Channel Ratio (VCR)
According to consolidated viewership data from Streams Charts and TwitchTracker, over 78% of all Twitch Hours Watched are locked down by just the top 1% of partnered streamers. In ultra-popular categories, organic discoverability for newcomers is virtually non-existent: a viewer has to scroll past 45 to 60 rows of thumbnails before catching a glimpse of a channel sitting under 10 viewers.
To quantify a title's viability before pressing "Go Live," we apply the Viewer-to-Channel Ratio (VCR) formula:
Interpreting the Ratio Based on SullyGnome Data:
- VCR < 15 (Red Zone / Black Hole): Oversaturated markets (Fortnite, Valorant, Apex Legends). For every 1,000 viewers, there are 80 competing streamers. You are completely invisible without an established external following.
- VCR between 25 and 55 (Neutral Zone): Mainstream action and sandbox survival games (Rust, Palworld, DayZ). Viable if supported by a distinct content hook or top-of-funnel TikTok and YouTube Shorts clipping.
- VCR > 60 (Sweet Spot / High Profitability): Deep tactical niches, complex RPGs, and simulators (Manor Lords, Total War, Escape from Tarkov). Audience hunger for guides and skilled gameplay vastly outstrips the supply of competent broadcasters.
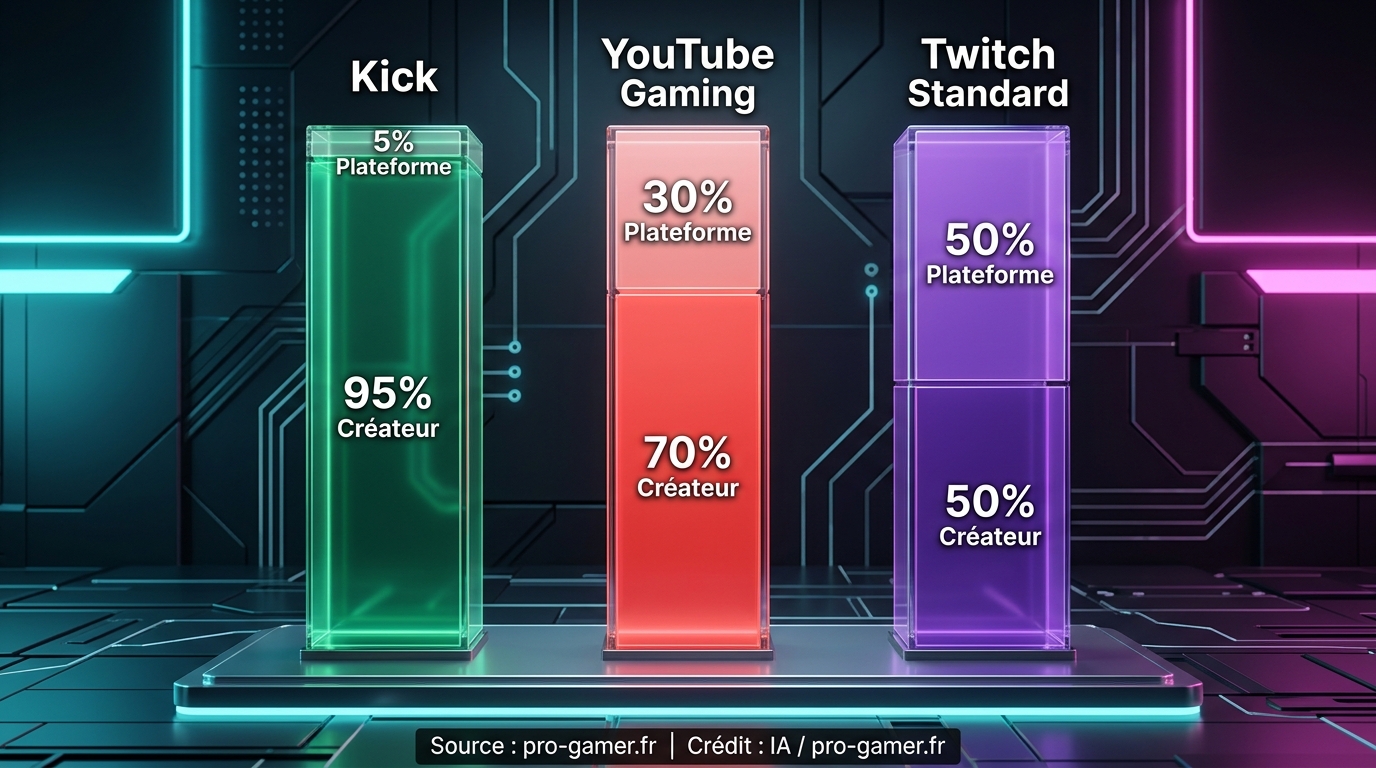
Official paid subscription revenue split (Tier 1) by platform in 2026. Source: pro-gamer.gg | Credit: AI / pro-gamer.gg
2. Real Platform Economics: Kick 95/5 vs Twitch 50/50 vs YouTube 70/30
Picking the right game is only half the battle: your platform's monetization model directly dictates your hourly earnings. Here are the verified breakdown numbers across official partner programs:
A. Kick (KCP: Kick Creator Program)
- Revenue Split: 95% creator / 5% platform.
- Net Payout: On a standard $4.99 subscription, after subtracting Stripe processing fees ($0.05 + 2.9%), the creator pockets approximately $4.68 net per sub.
- Bottom Line: With just 50 recurring subscribers, a streamer generates $234 net/month, compared to only $125 under the base Twitch affiliate split.
B. Twitch (Affiliate & Partner Plus Programs)
- Standard Affiliate & Baseline Partner: 50/50 split. On a standard $4.99 sub (or €3.99 localized pricing), the creator receives roughly $2.00 to $2.25 before taxes and processing fees.
- Partner Plus Program (Official 2026 Thresholds):
- Tier 1 (100 Plus Points): 60/40 split for 12 months.
- Tier 2 (350 Plus Points): 70/30 split for 12 months (with Twitch's previous $100K cap permanently eliminated).
- To maximize your ad revenue and subscription conversion, check out our deep dive into Twitch affiliate optimization and audience retention tactics.
C. YouTube Gaming (YouTube Partner Program)
- Revenue Split: 70% creator / 30% platform on channel memberships.
- Structural Advantage: The evergreen compound effect. A vod, replay, or edited walkthrough continues to rack up AdSense revenue (average gaming CPMs sitting between $4 and $9) for two to three years after hitting upload.
3. Profitability Matrix by Game Genre (2026 Benchmark)
This matrix cross-references median audience age (Newzoo Demographic Gaming Report), chat engagement velocity (Streamlabs State of the Stream), and average donation size:
To dive deeper into the economics of running and streaming dedicated sandbox servers, check out our guide on how open-world survival titles can revitalize your stream.
4. Cash Breakdown: Real Monthly Revenue Across 100 Streaming Hours (50 Average Viewers)
Let's examine a concrete real-world scenario: a creator streaming 25 hours per week (100 hours per month) maintaining an average of 50 concurrent viewers (CCV):
5. Methodology and Certified Official Data Sources
To ensure uncompromising analytical rigor, all statistical metrics and financial figures in this report are compiled from independent industry benchmarks and official platform documentation:
- Streams Charts Analytics (2025-2026): Consolidated data on Hours Watched, channel percentile distributions, and Viewer-to-Channel Ratios (VCR).
- Twitch Interactive Documentation: Local Subscription Pricing tier schedules, Partner Plus qualification thresholds (100 and 350-point tiers), and confirmation of the lifted $100,000 cap.
- Kick Creator Program (KCP) Whitepaper: Official 95/5 commission structure and Stripe merchant payment processing fee schedules.
- SullyGnome & TwitchTracker Databases: Chat engagement velocity per category and hourly viewer retention tracking.
- Newzoo Global Esports & Live Streaming Market Report: Audience demographic profiling, median age brackets, and disposable income indices across core gaming genres.
Streaming is no longer a hobby where luck alone makes a career. Creators who build sustainable, profitable businesses treat their channel like a specialized media brand: by targeting high-value niche categories, prioritizing community education and masterclasses, and diversifying revenue streams far beyond hitting the "Go Live" button.

SEO consultant for over 20 years and digital entrepreneur, Charles 'Grimtag' Ronchain is the founder of Pro-Gamer.gg, Retrocharting.com, and Gamescharting.com. A competitive gamer, streamer, and retro game collector, he has worked in the video game industry for over 15 years, notably as a consultant for leading game price comparison platforms. Passionate about real-time performance data and gaming technology, he analyzes competitive esports, gaming hardware benchmarks, and creator workflows on Pro-Gamer.gg with an authentic player perspective.