Physical Games Down to 5.2%, Subscriptions Up 371%, and €27.7 Billion Spent: What the Council of Europe's First Gaming Report Reveals
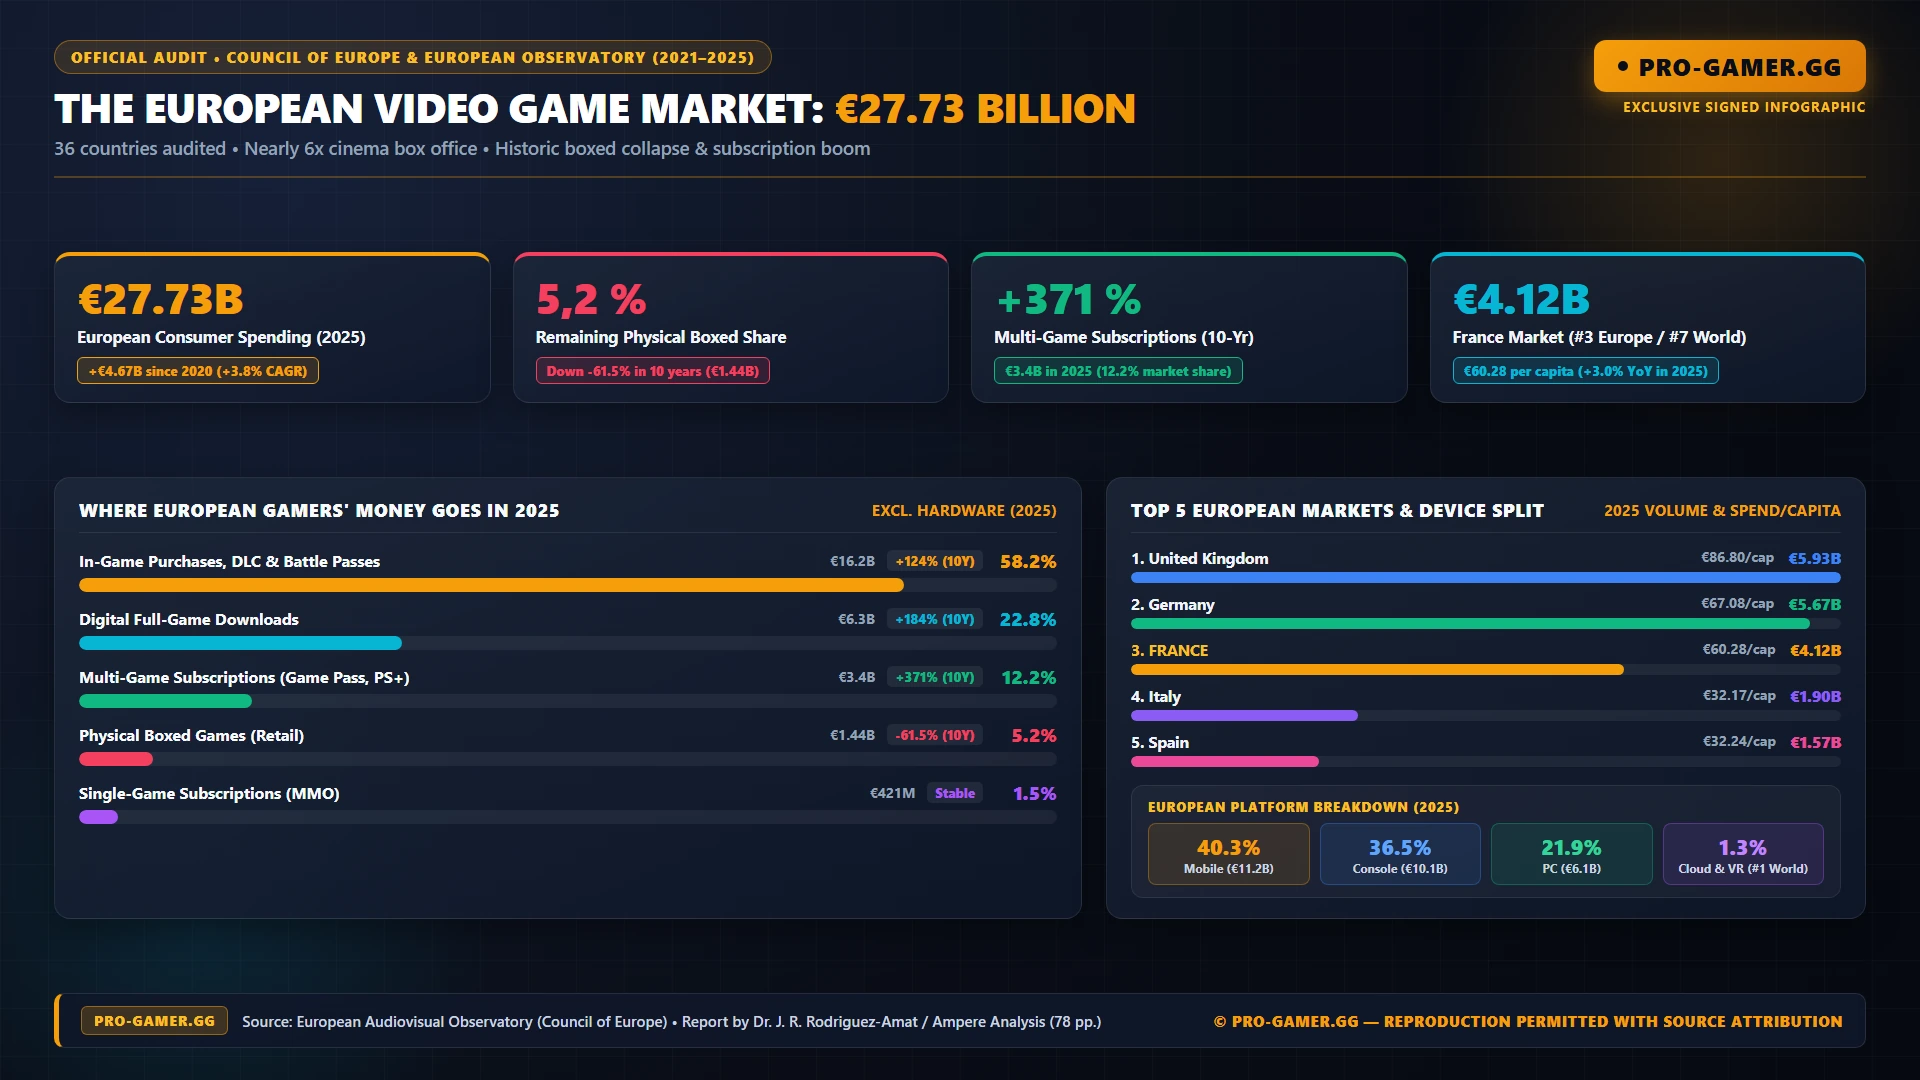
It is the most granular financial x-ray ever published on how Europeans play and pay for video games. On November 3, 2026, the European Audiovisual Observatory, part of the Council of Europe in Strasbourg led by Executive Director Pauline Durand-Vialle, released its inaugural publication dedicated to the gaming sector: The European market volume for video games: Consumer spending 2021-2025. Authored by Senior Video Games Analyst Dr. Joan Ramon Rodriguez-Amat under the supervision of Martin Kanzler using Ampere Analysis data across 101 global markets and 36 European territories (excluding VAT, hardware sales, and the second-hand/grey market), the 78-page report calculates that European gamers spent €27.73 billion in 2025,representing €47.29 per capita across 586.75 million inhabitants.
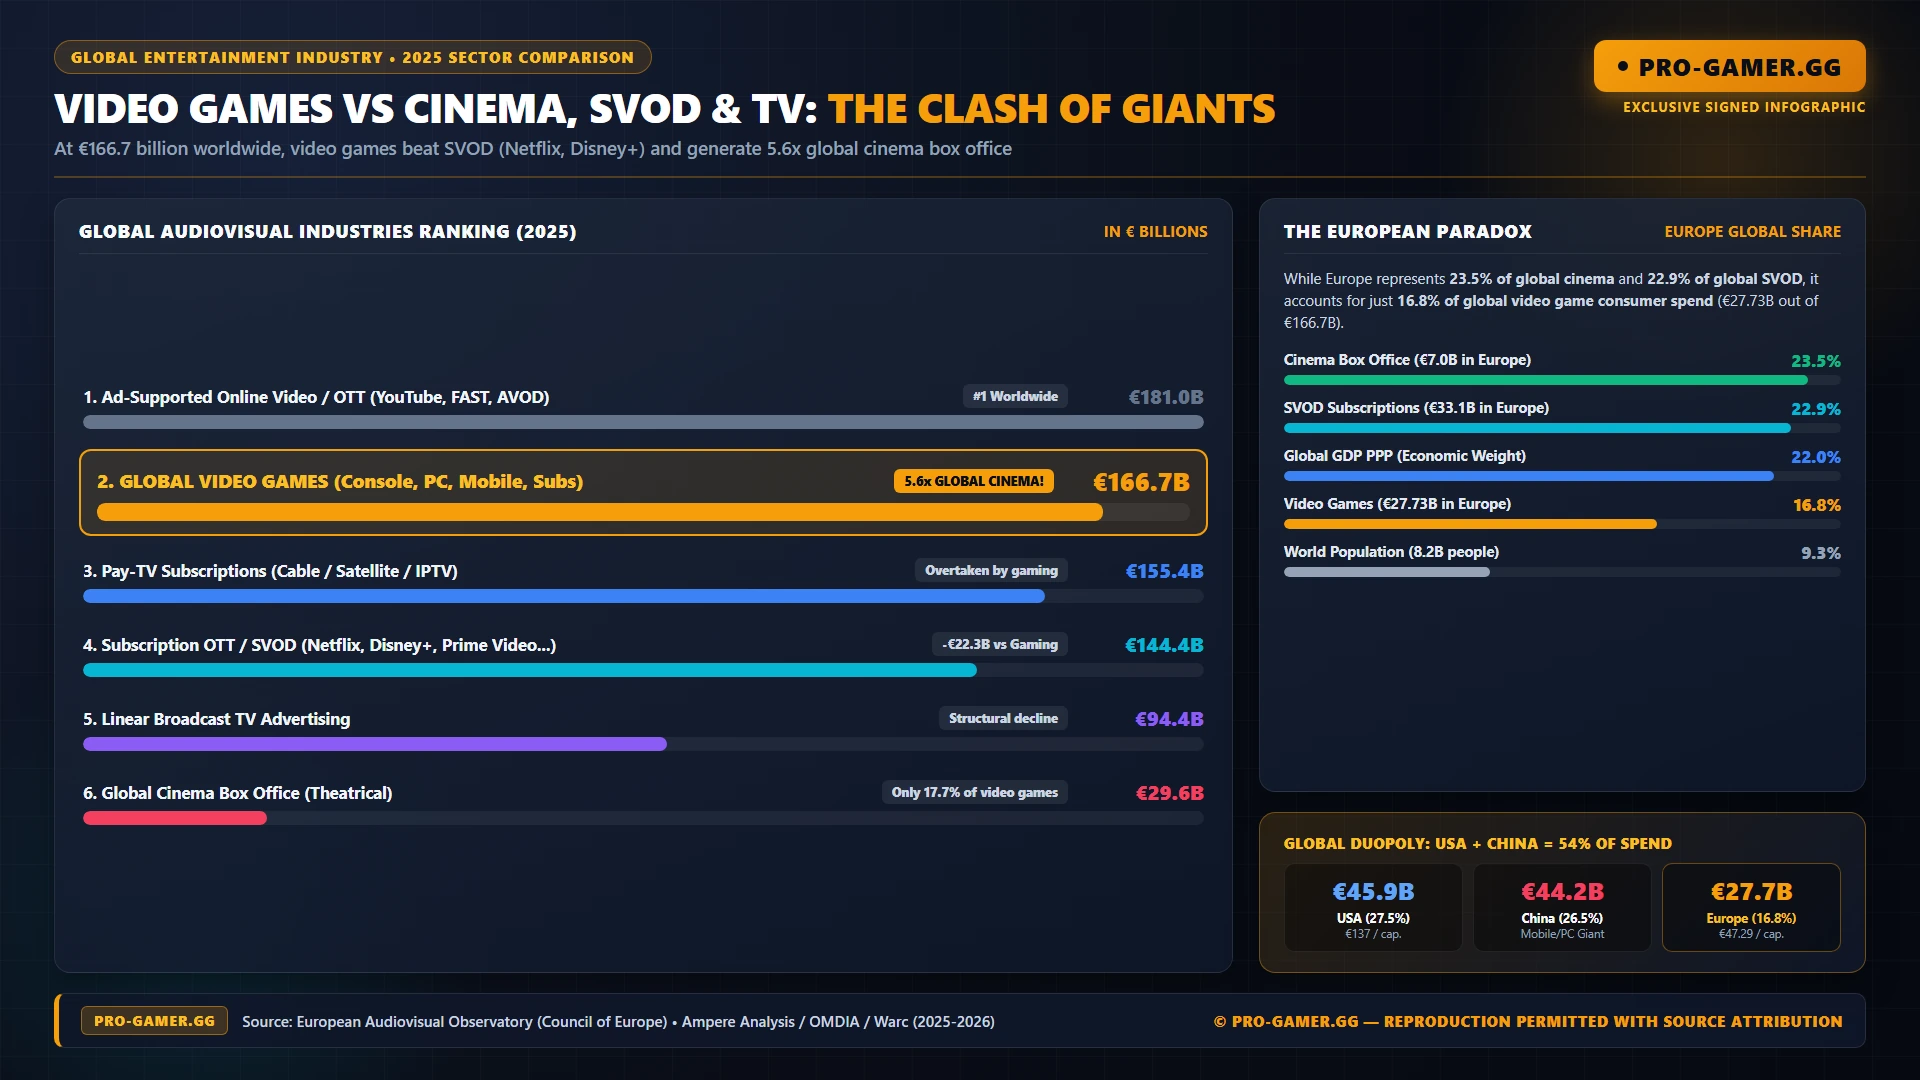
Over the past decade, European consumer spending nearly doubled from €14.3 billion in 2016 (+94%), making Europe the world's third-largest gaming region with 16.8% (roughly 17%) of global spending (€166.7 billion worldwide), trailing Asia (44.9% at €74.9 billion) and North America (29.7% at €49.4 billion). Unveiled alongside Paris Game Biz, this report launches a three-year pilot programme (2026-2028) at the Council of Europe; its next instalment, scheduled for early 2027, will map public funding and tax incentives across Europe, complementing the annual EGDF report on Europe's 6,600 development studios.
Nearly Six Times Larger Than Global Cinema Box Office, Yet Trailing Europe's SVOD Share
To put gaming's scale in perspective, the Observatory directly compares 2025 video game consumer spending against every other global audiovisual sector. At €166.7 billion worldwide, video games rank as the second-largest audiovisual market on Earth, trailing only ad-supported OTT video platforms like YouTube (€181.0 billion). Gaming now surpasses global Pay-TV revenues (€155.4 billion), all subscription SVOD platforms combined including Netflix, Disney+, Prime Video, and HBO Max (€144.4 billion), linear TV advertising (€94.4 billion), and dwarfs the global cinema box office (€29.6 billion) by nearly sixfold.
Within Europe, however, the report highlights a striking discrepancy: while Europe represents 9% of the world's population and 22.0% of global GDP (PPP), its 16.8% share of global gaming expenditure lags behind Europe's global share of cinema box office revenues (23.5%, €7.0 billion), subscription OTT streaming (22.9%, €33.1 billion), Pay-TV (22.6%, €35.2 billion), and linear TV advertising (26.3%, €24.8 billion).
From 84% in 2006 to 5.2% in Europe: The Collapse of Physical Boxed Games Against DLC and Subscriptions
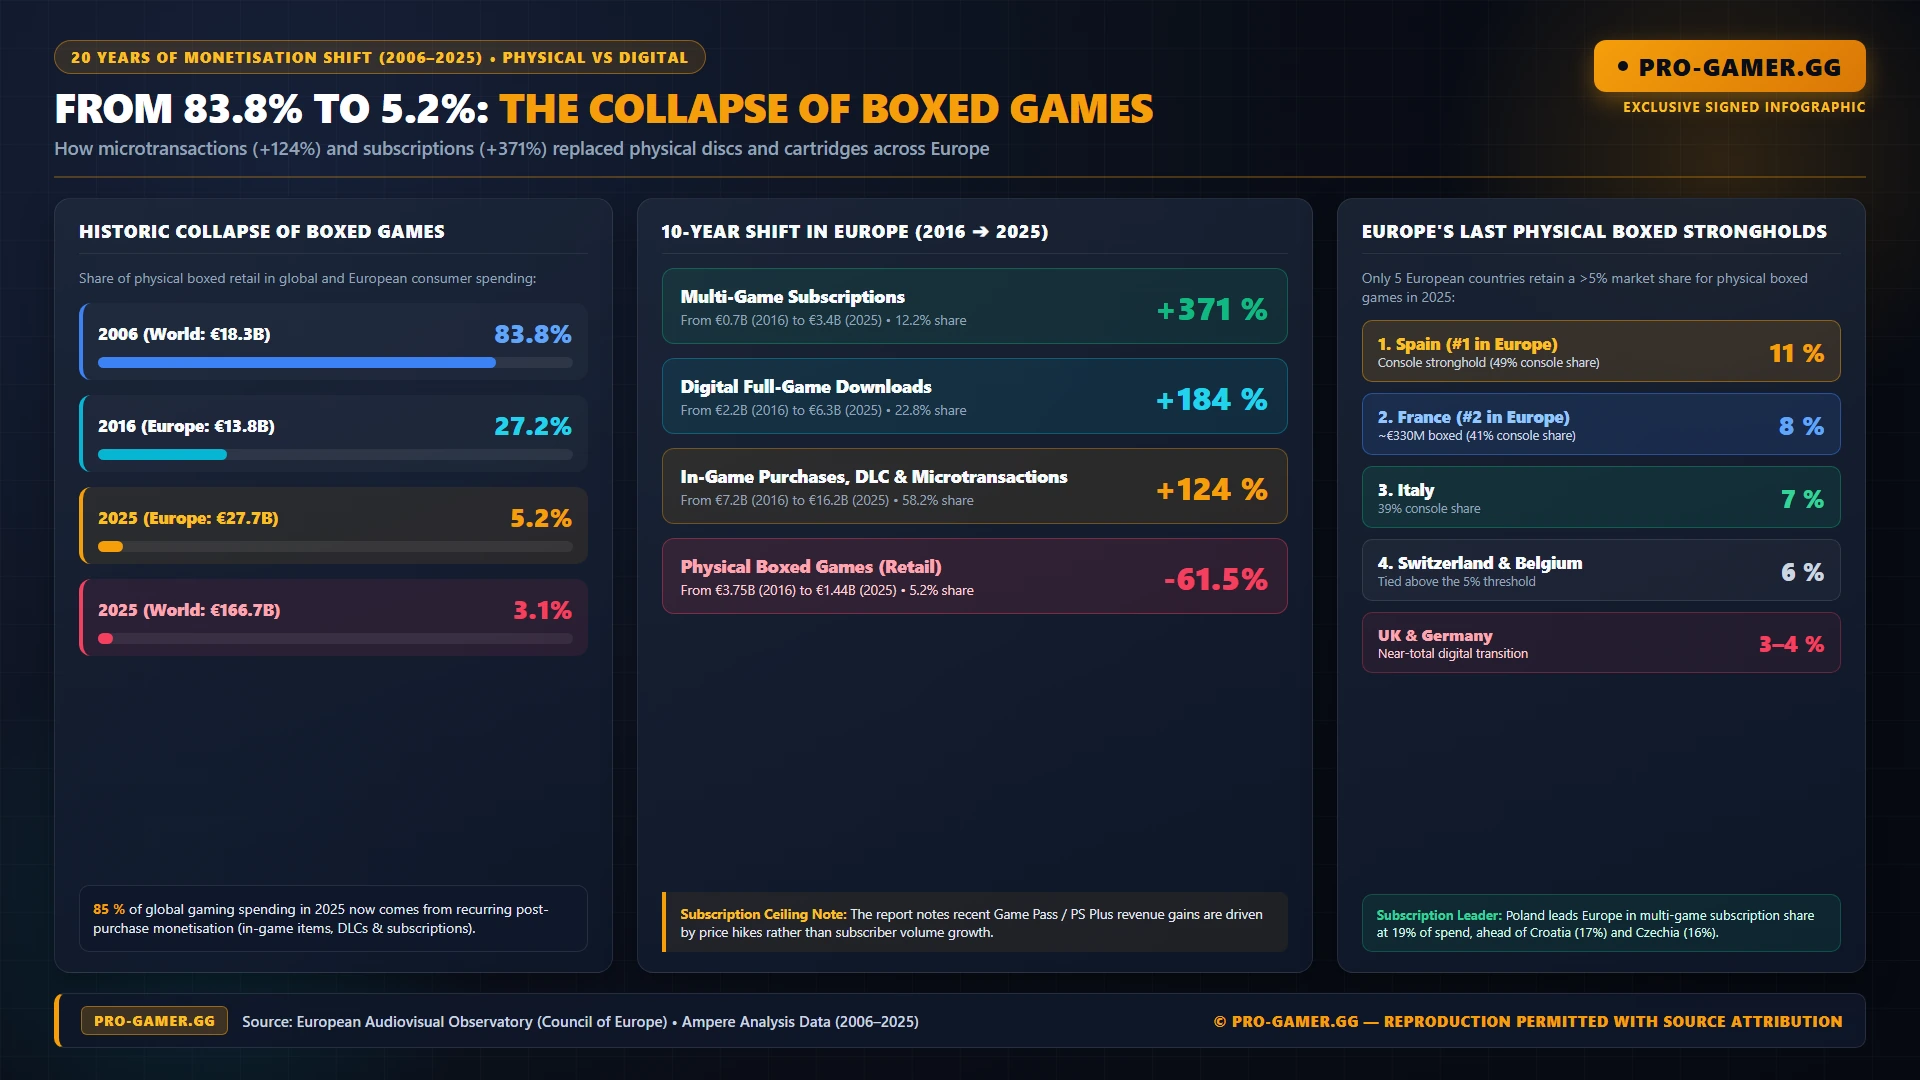
The report's most striking historical analysis tracks the 20-year transition from game ownership to recurring digital monetisation. Back in 2006, when the entire global video game market stood at just €18.3 billion, physical boxed retail accounted for 83.8% of global consumer spending (and 87% when combined with early digital full-game downloads), while in-game purchases and DLC represented just 6.7%. By 2015 (€76 billion globally), physical boxed games had fallen to 17.3% as in-game and DLC spending surged to 68.2%. By 2025, recurring monetisation (in-game purchases, DLC, and subscriptions) captures 85% of all consumer spending worldwide, leaving just 3.1% for physical boxed games globally (€5.2 billion) and 12.3% for digital full-game downloads (€20.6 billion).
In Europe, the contraction of physical retail over the past decade is equally severe: between 2016 and 2025, European physical boxed game sales plunged by -61.5%, dropping from €3.75 billion in 2016 to €1.44 billion in 2025 (5.2% of European spending). Over the same ten-year window, digital full-game downloads in Europe surged by +184%, climbing from €2.2 billion to €6.3 billion (22.8% of European spending).
| Monetisation Model | Europe Volume (2025) | European Share | 2016-2025 Change | Europe's Share of Global Total |
|---|---|---|---|---|
| In-Game Microtransactions & DLC | €16.20 billion | 58.2% | +124.0% (€7.2B in 2016) | 12.8% of global total (€127.5B) |
| Premium Full Game - Digital | €6.30 billion | 22.8% | +184.0% (€2.2B in 2016) | 30.8% of global total (€20.6B) |
| Multi-Game Subscriptions (PS Plus, Game Pass…) | €3.40 billion | 12.2% | +371.0% (€0.7B in 2016) | 29.4% of global total (€11.4B) |
| Premium Full Game - Physical Boxed | €1.44 billion | 5.2% | -61.5% (€3.75B in 2016) | 27.7% of global total (€5.2B) |
| Single-Game Subscriptions (WoW, etc.) | €421 million | 1.5% | Stable | 21.2% of global total (€2.0B) |
Two granular findings stand out in the monetization breakdown:
- Europe's Last Four Strongholds for Boxed Games: By 2025, only four European nations still record a physical boxed game share above 5%: Spain leads Europe at 11%, followed by France at 8%, Italy at 7%, and Switzerland and Belgium at 6%. In both the United Kingdom and Germany, physical discs and cartridges have already fallen to roughly 3-4% of spending.
- Subscription Price Hikes vs. Subscriber Ceilings: While multi-game subscriptions jumped +371% across Europe over the decade (and +384% worldwide since 2016), reaching their highest national shares in Poland (19% of total spending), Croatia (17%), the Czech Republic (16%), Spain (15%), the UK (14%), Italy (13%), and France (12%), the Observatory explicitly notes that recent revenue growth for services like Xbox Game Pass and PlayStation Plus has been driven primarily by subscription price increases rather than subscriber volume growth. Meanwhile, the dominance of microtransactions (58.2% in Europe) directly informed Brussels' recent consumer-protection crackdown requiring mandatory real-money euro pricing alongside virtual currencies.
Steady PC Expansion, Post-2020 Console Stagnation, and Global Leadership in Cloud Gaming
Unlike Asia (where mobile captures 73% of spending at €53.6 billion) or Africa (80% mobile), Europe maintains a balanced three-pillar device ecosystem, though 10-year trajectories diverge sharply:
- Mobile (40.3% in Europe, €11.2-€11.4 billion): The primary engine of European spending growth over the decade, surging +159% between 2016 (€4.3B) and 2025. Even so, Europe accounts for only 11.4% of global mobile gaming revenue (€101.4B).
- Home Consoles (36.5% in Europe, €10.1-€10.4 billion): While European console spending grew +70% between 2016 and 2025 and represents a vital 29.2% of global console revenues (second only to North America's €17.8 billion), the report reveals that European console spending has largely plateaued since the 2020 pandemic peak, recording only ~7% cumulative growth across the entire 2020-2025 stretch.
- PC (21.9% in Europe, €6.1-€6.5 billion): Unlike consoles, European PC gaming did not level off after 2020, expanding steadily by +50% between 2016 and 2025 and capturing 18.6% of global PC gaming revenues (€31.4B).
- Cloud Gaming (€179 million) and Virtual Reality (€193.4 million): Although combined Cloud and VR spending represents just over 1% of Europe's domestic total, Europe is the world's #1 Cloud Gaming market (capturing 38.2% of global revenues and beating North America by +47%) and trails North America by less than 3% in standalone VR/XR spending (39.1% of global VR revenues, €193.4M vs. €199.9M).
Global Top 10 Comparison and Europe's Three Statistical Clusters
Worldwide, just two nations generate 54% of all consumer spending: the United States (€45.9 billion, 27.5% global share) and China (€44.2 billion, 26.5%), followed by Japan (€13.2B) and South Korea (€8.2B, which holds the world's highest per-capita spending at €159 per person, ahead of the US at €137 and Taiwan at €126). Only three European countries make the global Top 10: the United Kingdom (#5 globally at €5.93B), Germany (#6 at €5.67B), and France (#7 at €4.12B), ahead of Canada (€3.5B), Taiwan (€3.0B), and Australia (€2.2B). Notably, while the US (-2.6%), Japan (-6.4%), and South Korea (-2.8%) contracted in 2025, France posted the strongest annual growth among major Western markets (+3.0% YoY in 2025).
Using unsupervised K-means statistical clustering, Dr. Joan Ramon Rodriguez-Amat divides Europe into three structurally distinct gaming ecosystems:
- Cluster 1 , 18 Balanced Multi-Platform & Console-Heavy Markets (Median €57.70/capita): Includes all six European markets above €1 billion (UK, Germany, France, Italy, Spain, Netherlands) alongside Poland, Belgium, Sweden, Switzerland, Czech Republic, Austria, Denmark, Norway, Ireland, Finland, Greece, and Hungary. Dedicated consoles average 38% share here, peaking in Spain (49%), the UK (48%), Ireland (42%), and France (41%), alongside 39% mobile and 21% PC.
- Cluster 2 , 12 PC-Mobile Dual Ecosystems in Central & Eastern Europe (Median €17.00/capita): Encompasses Ukraine, Romania, Slovakia, Bulgaria, Croatia, Serbia, Lithuania, Slovenia, Estonia, Latvia, Moldova, North Macedonia, and Albania (with Portugal sitting on the statistical edge between Clusters 1 and 2 at 38% PC, 41% mobile, and 20% console). Across Cluster 2, home consoles account for less than 1% of spending (just €14 million combined across all 12 countries!), replaced by PC (44% average, reaching 55% in Serbia and 60% in Moldova) and mobile (55%), with 68% of revenue generated by free-to-play microtransactions.
- Cluster 3 , 3 Mobile-Dominant Micro-Markets (Median €15.38/capita): Comprises Luxembourg (100% mobile), Malta (99% mobile), and Cyprus (98% mobile), where physical retail is non-existent and 94% of spending flows into mobile in-app purchases.
| Rank | Country | 2025 Volume (€M) | 2020-2025 Change | Spend / Capita | Platform Split & Key Monetisation |
|---|---|---|---|---|---|
| 1 | United Kingdom | €5,928.61M | +€917M (+3.4%/yr) | €86.80 (#1 Europe) | 48% Console, 35% Mobile, 17% PC (14% Subscriptions) |
| 2 | Germany | €5,668.11M | +€1,044M (+4.2%/yr) | €67.08 | 45% Mobile, 31% Console, 23% PC (63% In-Game/DLC) |
| 3 | France | €4,123.48M | +€484M (+2.5%/yr) | €60.28 | 41% Console, 36% Mobile, 20% PC (8% Physical, 12% Subs) |
| 4 | Italy | €1,895.04M | +€358M (+4.3%/yr) | €32.17 | 43% Mobile, 39% Console, 17% PC (7% Physical, 13% Subs) |
| 5 | Spain | €1,566.75M | +€266M (+3.8%/yr) | €32.24 | 49% Console (#1), 27% Mobile, 22% PC (11% Physical #1) |
| 6 | Netherlands | €1,044.24M | +€190M (+4.1%/yr) | €58.01 | 48% Mobile, 31% Console, 20% PC (63% In-Game/DLC) |
| 7 | Poland | €994.26M | +€290M (+7.2%/yr) | €27.17 | 36% PC, 34% Console, 29% Mobile (19% Subscriptions #1) |
| 8 | Belgium | €680.79M | +€134M (+4.5%/yr) | €57.45 | 40% Mobile, 39% Console, 20% PC (6% Physical, 11% Subs) |
| 9 | Sweden | €638.07M | +€85M (+2.9%/yr) | €60.37 | 49% Mobile, 29% Console, 21% PC (12% Subscriptions) |
| 10 | Switzerland | €596.39M | +€94M (+3.5%/yr) | €66.56 | 44% Mobile, 38% Console, 15% PC (6% Physical, 12% Subs) |
| 11 | Czech Republic | €441.62M | +€131M (+7.3%/yr) | €40.59 | 38% Console, 34% Mobile, 28% PC (16% Subscriptions) |
| 12 | Austria | €437.36M | +€60M (+3.0%/yr) | €47.75 | 49% Mobile, 30% Console, 20% PC (10% Subscriptions) |
| 13 | Ukraine | €433.48M | -€8M (-0.1%/yr) | €11.72 | 63% Mobile, 36% PC, <1% Console (70% In-Game/DLC) |
| 14 | Denmark | €413.71M | +€68M (+3.7%/yr) | €69.30 (#2 Europe) | 45% Mobile, 28% Console, 25% PC (11% Subscriptions) |
| 15 | Portugal | €392.84M | +€69M (+3.9%/yr) | €37.06 | 41% Mobile, 38% PC, 20% Console (31% Digital Full Game) |
| 16 | Norway | €361.53M | +€40M (+2.5%/yr) | €64.91 | 48% Mobile, 31% Console, 19% PC (12% Subscriptions) |
| 17 | Ireland | €326.96M | +€59M (+4.1%/yr) | €60.77 | 42% Console, 42% Mobile, 14% PC (13% Subscriptions) |
| 18 | Romania | €321.46M | +€83M (+6.2%/yr) | €16.92 | 55% Mobile, 43% PC, <1% Console (Cluster 2) |
| 19 | Finland | €319.66M | +€56M (+4.0%/yr) | €56.98 | 42% Mobile, 32% Console, 25% PC (11% Subscriptions) |
| 20 | Greece | €257.83M | +€54M (+4.8%/yr) | €25.03 | 51% Mobile, 27% Console, 20% PC (13% Subscriptions) |
| Total | Europe (36 markets) | €27,725.78M | +€4,674M (+3.8%/yr) | €47.29 | 40.3% Mobile, 36.5% Console, 21.9% PC, 1.3% Cloud/VR |
Beyond the Top 20 above, the report also provides complete figures for the remaining 16 tracked territories: Hungary (#21 at €231.16M, €24.13/capita), Slovakia (#22 at €134.05M, €24.73/capita, +7.5%/yr), Bulgaria (#23 at €100.32M, €15.60/capita), Croatia (#24 at €89.98M, €23.37/capita, posting Europe's highest average annual growth rate at +9.1%/yr between 2020 and 2025), Serbia (#25 at €64.57M, €9.78/capita, 55% PC), Lithuania (#26 at €48.93M, €16.99/capita), Slovenia (#27 at €35.73M, €16.86/capita), Estonia (#28 at €33.72M, €24.62/capita), Latvia (#29 at €31.65M, €16.93/capita), Moldova (#30 at €26.19M, €10.56/capita, 60% PC), North Macedonia (#31 at €22.83M, €12.48/capita), Albania (#32 at €22.20M, €8.13/capita), Armenia (#33 at €21.25M, €7.16/capita), Luxembourg (#34 at €20.19M, €30.13/capita), Cyprus (#35 at €12.51M, €9.93/capita), and Malta (#36 at €8.31M, €15.38/capita), alongside Türkiye (grouped under the Middle East region by the Observatory at €968.24M, €11.28/capita, with a 46% PC share).
My Take
Going through all 78 pages of the Strasbourg report, two numbers sum up the sheer brutality of the transition we are living through: in twenty years, physical boxed games have collapsed from 83.8% of the global market in 2006 to 3.1% worldwide and 5.2% in Europe (-61.5% across the continent in a single decade). Even in Spain (11%) and France (8%), Europe's last holdouts for plastic cases, the financial reality has already shifted to a model where 85% of global revenue comes from recurring digital tolls. Even more telling: seeing European console revenue plateau at just +7% total growth over five years while PC climbs +50% and dominates Eastern Europe proves that endless console hardware and subscription price hikes are hitting a very real wall.

SEO consultant for over 20 years and digital entrepreneur, Charles "Grimtag" is the founder of Pro-Gamer.gg, Retrocharting.com, and Gamescharting.com. A competitive gamer, streamer, and retro game collector, he has worked in the video game industry for over 15 years, notably as a consultant for leading game price comparison platforms. Passionate about real-time performance data and gaming technology, he analyzes competitive esports, gaming hardware benchmarks, and creator workflows on Pro-Gamer.gg with an authentic player perspective.